In this lesson
- learn to read the order book and the spread
- work out what a market order really pays
- understand the depth chart and why not to trust every "wall"
The last price in the header is just the last trade. What you pay is decided by the order book: a list of everyone who is waiting right now for someone to buy from them or sell to them.
What the book looks like#
| Side | Price (EUR) | Amount (BTC) |
|---|---|---|
| sell | 60,050 | 3.0 |
| sell | 60,020 | 1.2 |
| sell | 60,010 | 0.5 |
| last price | 60,000 | |
| buy | 59,990 | 0.8 |
| buy | 59,980 | 1.5 |
| buy | 59,950 | 2.5 |
A sample book – a real one is much longer.
- Red rows at the top – sellers and the least they will sell for. The lowest of them (60,010) is the price you buy at right away.
- Green rows at the bottom – buyers and the most they will pay. The highest (59,990) is the price you sell at right away.
- The difference between them is the spread – 20 euros here. The more liquid the market, the smaller the spread.
The icons above the book switch the view: both sides, buys only, sells only. The number on the right (0.01) groups prices – with a step of 10 you see a few larger levels instead of hundreds of tiny rows.
What a market order pays#
A real order book on Binance:
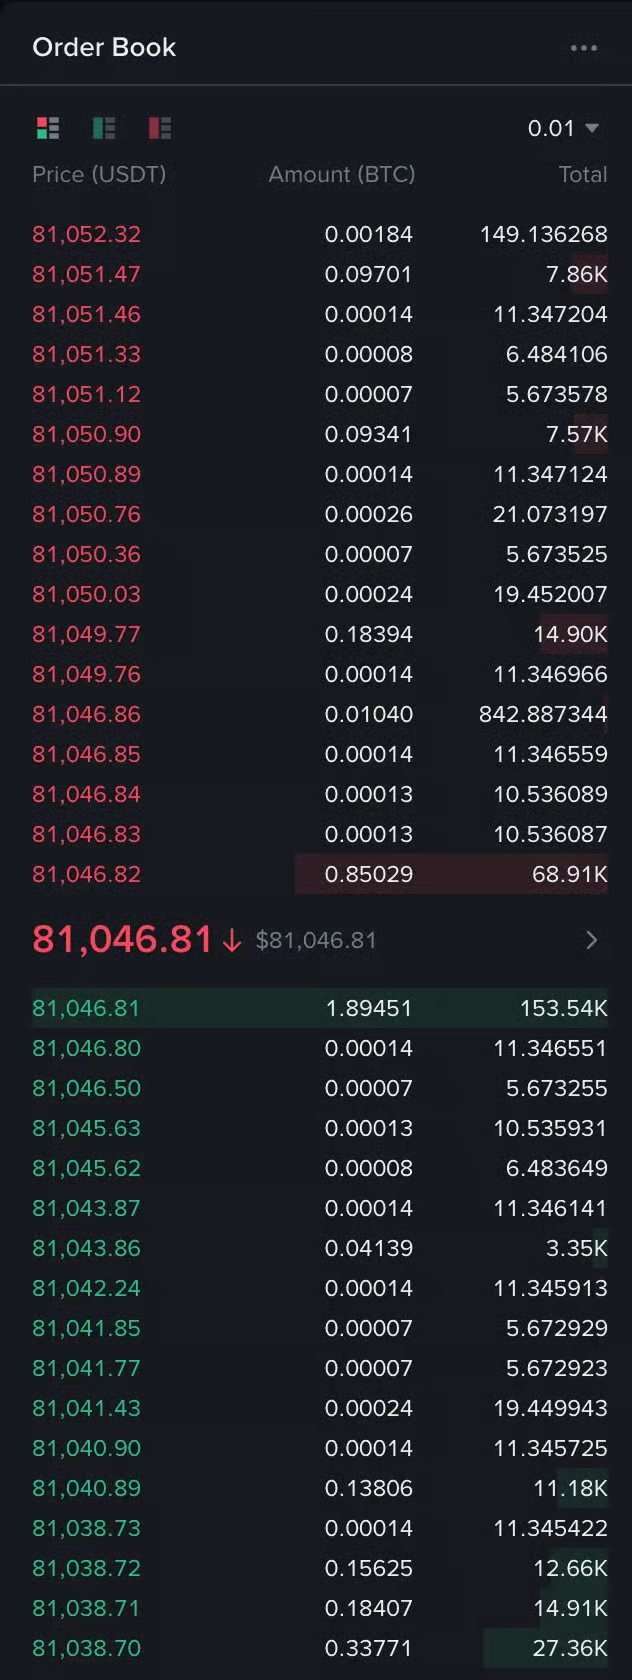
A market buy takes the offers from the bottom of the red part until it has the whole amount:
| Purchase | Average price | Per BTC vs the last price |
|---|---|---|
| 0.1 BTC | 60,010 | +10 € |
| 1 BTC | 60,015 | +15 € |
| 2 BTC | 60,022 | +22 € |
The bigger the purchase, the deeper it reaches into the book and the more it pays – that is slippage. For bitcoin on a big exchange it is negligible. For small altcoins with a thin book, one purchase can move the price by several percent.
The depth chart#
The Depth switch shows the book as two mountains: green on the left (buys) and red on the right (sells). The height of a mountain is the total of all offers up to that price – the so-called market depth. A steep mountain means many offers near the price; the gap in the middle is the spread.
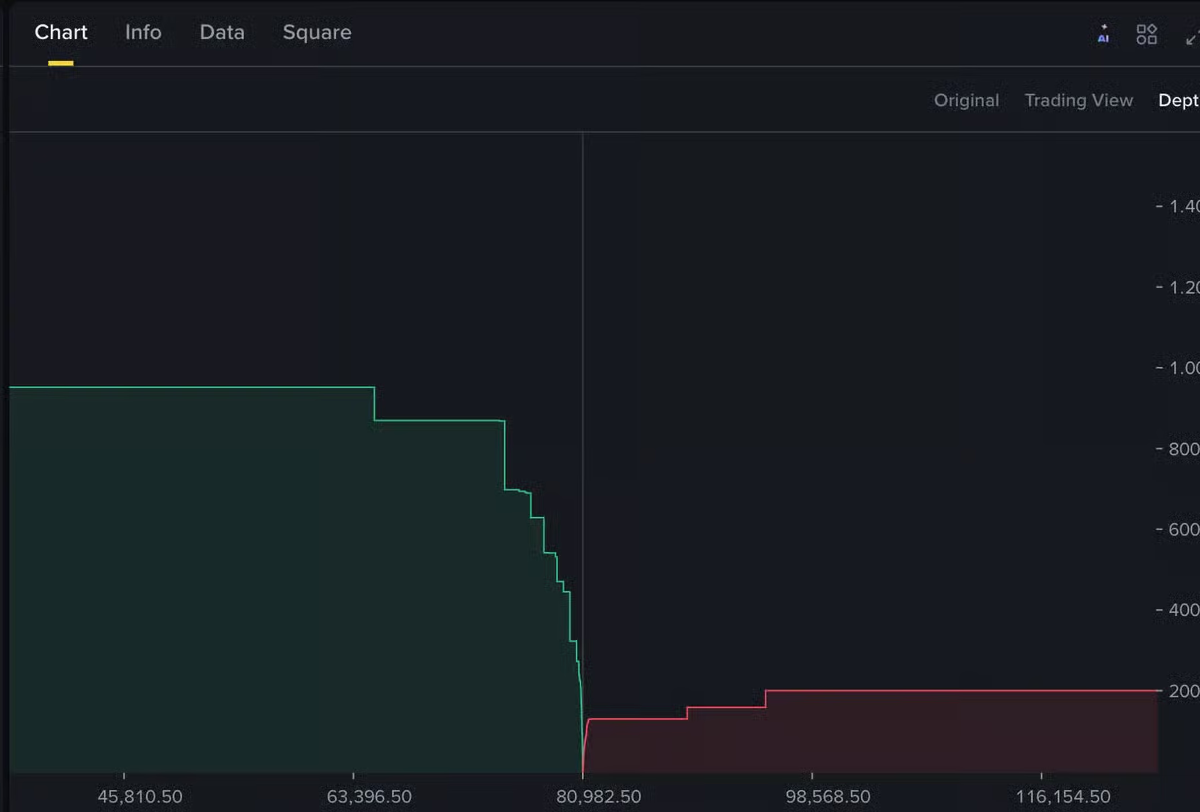
The rounding button (0.01 / 0.1 / 1 / 10) groups prices into steps to make the book easier to read.
Walls may not be real
A huge offer at one price – a "wall" – looks like solid support. But someone can pull it within a second. Placing fake offers nobody intends to fill is banned manipulation on regulated markets, and it still happens.
Common myths#
- "I will buy at the last price." You buy at the lowest sell offer – and with a bigger amount, higher.
- "A big wall will stop the price." As long as it is there. Walls can vanish.
- "The spread is the exchange's fee." The spread is the gap between buyers and sellers; the fee is paid on top.
Summary
- The order book: red sells at the top, green buys at the bottom; the gap between the best is the spread.
- A market buy takes offers step by step – the bigger it is, the higher the average price (slippage).
- The depth chart shows the book as two mountains; steep mountains = many offers near the price.
- Walls in the book can disappear – do not rely on them.