In this lesson
- decode every abbreviation in the indicator menu in one sentence
- find out what is drawn over the candles and what goes into the panel below
- choose three indicators to start with – and leave the rest off
The indicator menu is like a buffet: twenty dishes and everything looks tempting. Whoever takes some of everything ends up with so many lines on the chart that the candles disappear under them. Professor Wick calls it indicator soup – and does not recommend it.
Two kinds of indicators#
- Over the candles (main chart) – lines in the same units as the price: averages, bands.
- Below the chart (panel) – their own scale: volume, oscillators, momentum.
Where the menu is on Binance#
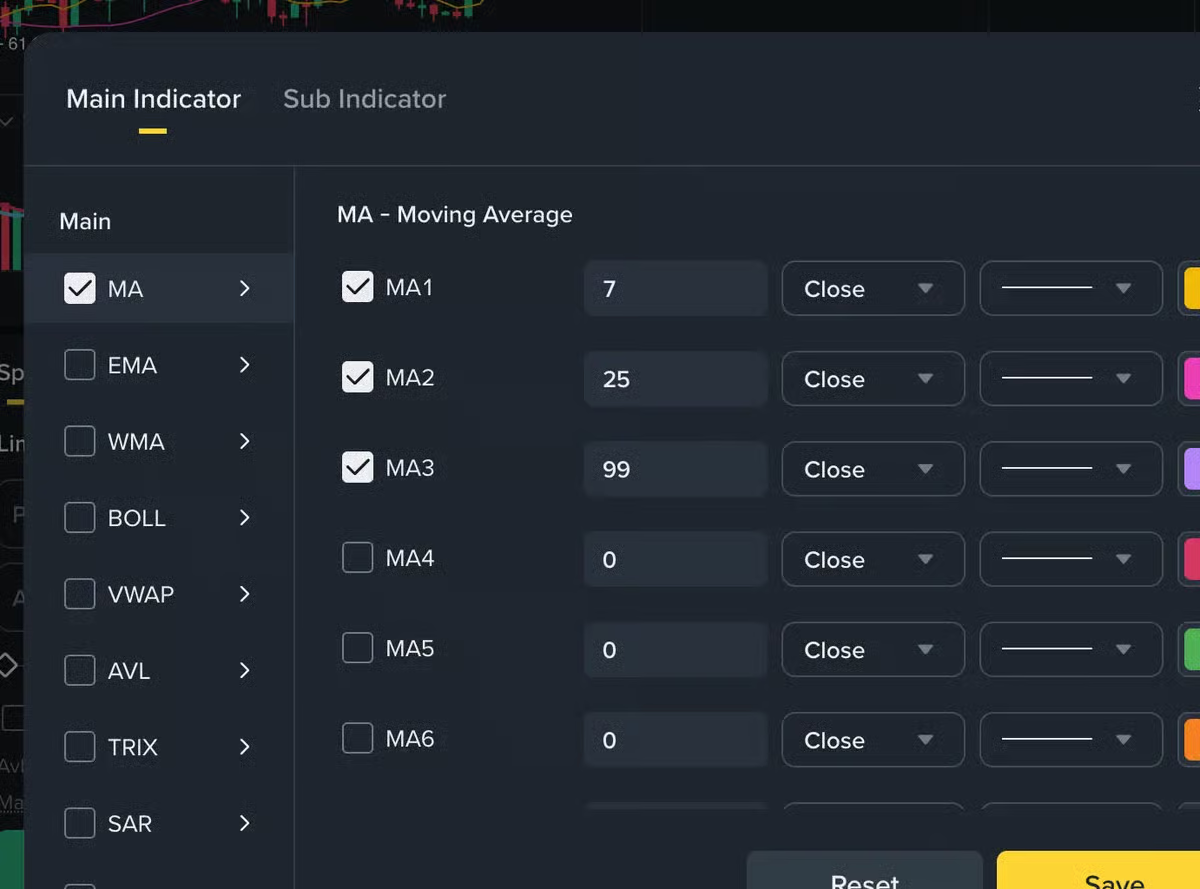
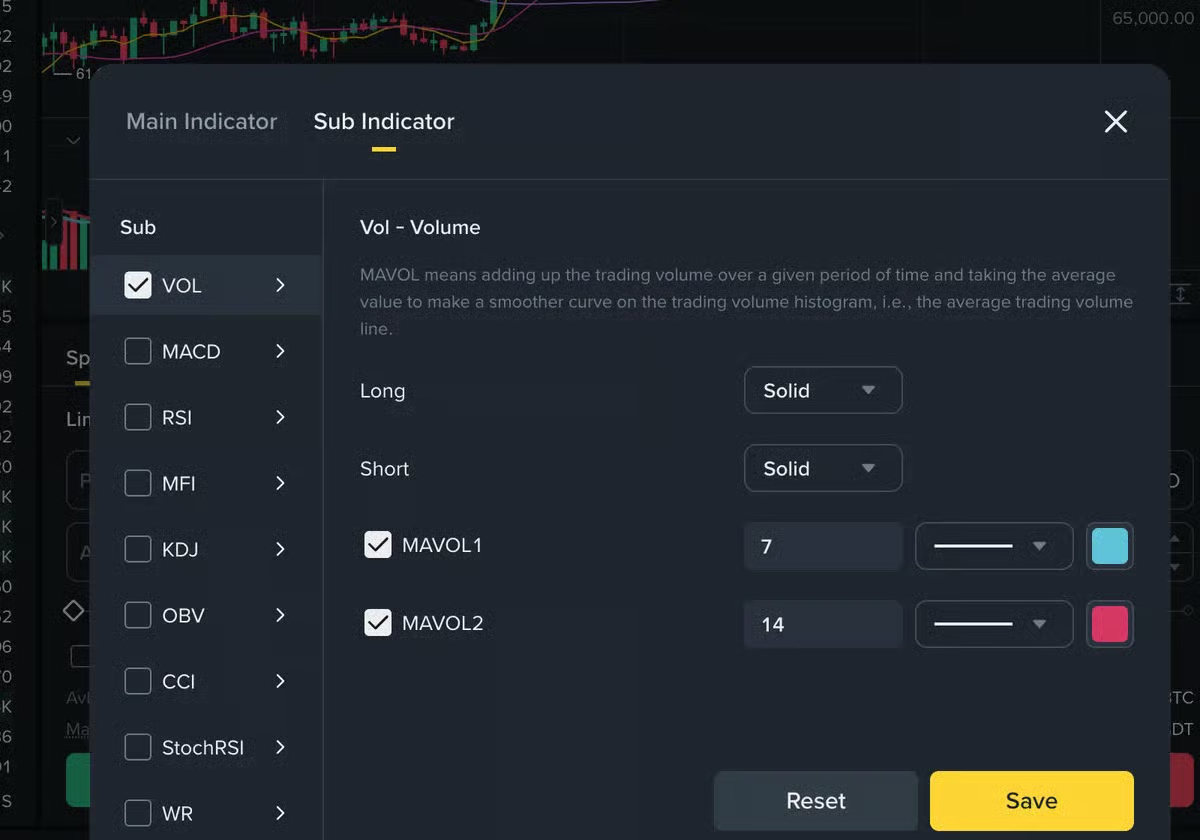
On Binance you open the indicators with an icon above the chart. The dialog has two tabs: Main Indicator (over the candles) and Sub Indicator (below the chart). For each indicator you set the length, colour and line width.
Over the candles#
| Abbreviation | What it is in one sentence |
|---|---|
| MA | moving average – the average price over the last N candles; smooths out noise and shows direction |
| EMA | exponential average – like MA, but recent candles weigh more, so it reacts faster |
| BOLL | Bollinger Bands – an average with two bands around it; the wilder the market, the wider they get |
| SAR | dots above or below the candles that "trail" the price; when they flip to the other side, the trend may be turning |
| VWAP | volume-weighted average price – what those who traded paid on average |
| WMA | weighted average – recent candles weigh more, similar to EMA |
| AVL | the day's average price – a line of the average trade price |
| TRIX | a triple-smoothed average showing the pace of the trend |
| SUPER | Supertrend – a line below the price in a rise and above it in a fall, derived from ATR |
Below the chart#
| Abbreviation | What it is in one sentence |
|---|---|
| VOL | volume – how much was traded in each candle |
| MACD | MACD – the difference of two averages and its signal line; shows the strength and turning of a trend |
| RSI | RSI – the strength of rises against falls on a 0–100 scale; above 70 "overbought", below 30 "oversold" |
| StochRSI | the RSI of the RSI – even more sensitive and even more jumpy |
| KDJ | a relative of the stochastic oscillator – where the price is within the range of the last candles |
| OBV | volume added on up candles and subtracted on down candles |
| ATR | the average range of a candle – measures volatility (not in Binance's menu; Supertrend is built from it) |
| MFI | like RSI, but also takes volume into account |
| CCI | how far the price is from its average |
| WR | Williams %R – where the close sits within the range of the last candles |
Three to start with#
On many exchanges the chart opens with a trio of averages, MA(7), MA(25) and MA(99) – the number in brackets is the number of candles. Here is how it looks with volume and RSI on Bitcoin's daily chart:
- SMA 7
- SMA 25
- SMA 99
- Volume (panel below the chart)
- RSI 14 (panel below the chart, lines at 30 and 70)
To start, this is enough:
- VOL – shows whether a move has interest behind it.
- One or two averages – the default MAs, or longer ones (50 and 200 days) for the direction of the trend.
- RSI – whether the market is running too fast in one direction.
Turn the others on once you know what you need them for. How to use indicators in depth is taught in the Trading with a plan course.
An indicator does not see the future
All indicators are calculated from past prices. None knows where the price will go tomorrow. More indicators do not give more certainty – just more lines that can contradict each other.
Try it yourself#
Why 7, 25 and 99? Move the period of the moving average and watch how often the price crosses it. A short average hugs the price and gives lots of signals; a long one is calm and late.
The price crossed the line 41×. The common default setting – try moving the slider both ways.
Now try it on the chart yourself:
Click the candle where the fast MA 7 (blue) crossed the slower MA 25 (yellow) from below.
No candle picked yet.
Common myths#
- "The more indicators, the more accurate the signal." Most measure the same thing with a different equation – and contradict each other.
- "RSI above 70 = sell." A strong trend can stay "overbought" for weeks.
- "The default settings are the best." They are just the defaults, not a recommendation.
Summary
- Over the candles: MA, EMA, BOLL, SAR, VWAP. Below the chart: VOL, MACD, RSI, StochRSI, KDJ, OBV, ATR.
- The number in brackets (MA(7)) is the number of candles the indicator is calculated from.
- Volume, one or two averages and RSI are enough to start.
- Indicators are calculated from the past; more lines do not mean more certainty.