In this lesson
- decode the timeframe abbreviations and the figures above the chart
- see the same week on an hourly and a daily chart
- find out when the daily candle closes and what the switches in the chart's corner are for
Above the chart is a row of buttons that looks like a safe combination: 1m, 15m, 1H, 4H, 1D, 1W, 1M. And when you hover over a candle, O, H, L, C, Vol and a few numbers pop up. None of it is secret – just abbreviated so it fits.
Timeframes#
The so-called timeframe says how long a period one candle summarises:
| Abbreviation | One candle = |
|---|---|
| 1m | 1 minute |
| 15m | 15 minutes |
| 1H (1h) | 1 hour |
| 4H | 4 hours |
| 1D | 1 day |
| 1W | 1 week |
| 1M | 1 month |
On Binance a row of timeframes sits right above the chart, and more are in the arrow next to them:
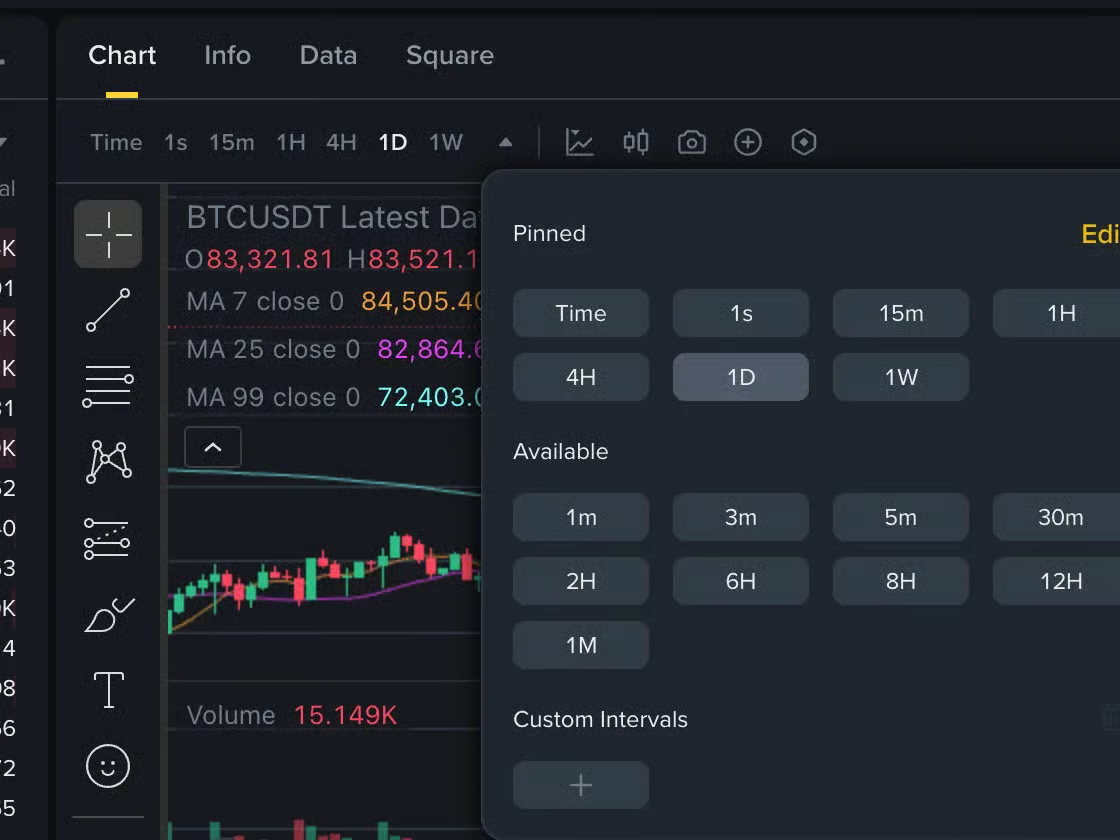
Watch out for 1m and 1M: a lowercase m is a minute, an uppercase M a month. There is a factor of roughly 43,000 between them.
The same week, two charts#
The week from 4 to 10 March 2024 on an hourly chart:
- Volume (panel below the chart)
And the same period on a daily chart, as part of half a year:
- That week: Mar 4 – 10, 2024
On the hourly chart, 5 March looks like a disaster. On the daily chart it is one long wick in an uptrend. That is why traders start with a longer timeframe – it shows the direction – and use shorter ones only for timing.
Find the daily candle that hides the whole fall from the hourly chart – the one with a long lower wick.
No candle picked yet.
The figures above the chart#
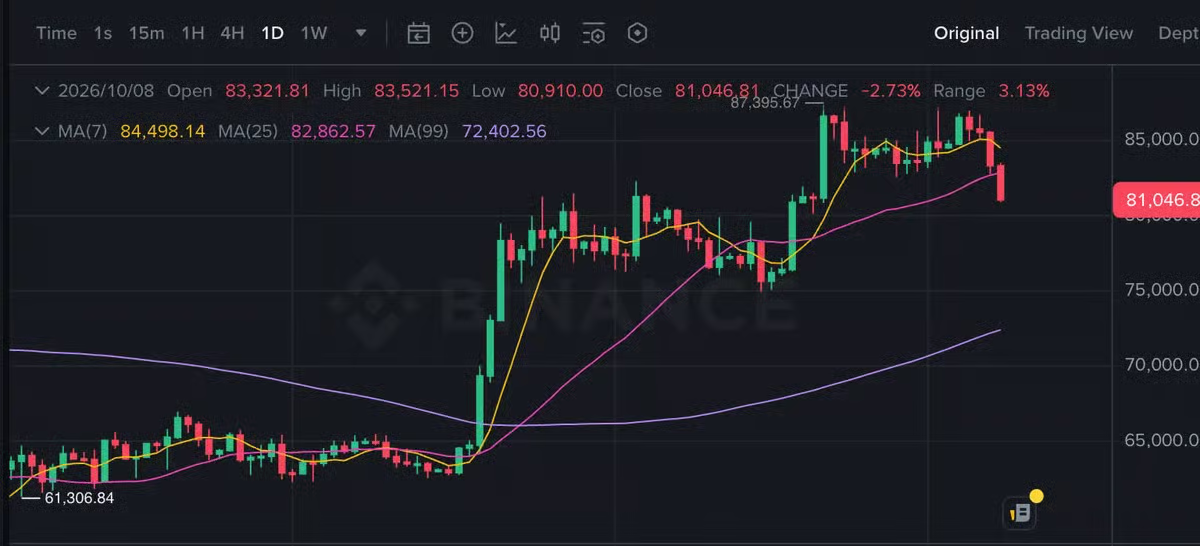
When you hover over a candle, you see:
- O (open) – the candle's opening price,
- H (high) – the highest price,
- L (low) – the lowest price,
- C (close) – the closing price,
- Vol – volume, how much was traded,
- Change – how many percent the close is away from the open.
The values after indicator names, such as MA(7): 67,210, show where that line is at that moment. Indicators have the next lesson.
On Binance the line above the chart looks like this:
When the daily candle closes#
Exchanges usually count the day in world time, UTC. So the daily candle closes at midnight UTC – in Central Europe that is 1:00 in winter and 2:00 in summer, not at local midnight.
The switches in the chart's corner#
- log – logarithmic scale: the same distance on the axis is the same percentage change. Useful for long charts where the price grew many times over.
- % – the axis in percent from the start of the visible period.
- auto – the chart fits itself to the height of the visible candles.
On Binance you find the same in Trading View mode: the gear at the bottom right opens the scale menu, and clicking the time next to it offers time zones.
Shorter timeframe, more noise
On minute charts the price twitches constantly and every move looks important. Beginners do better with daily and four-hour charts – fewer signals, fewer emotions, fewer unnecessary trades.
Common myths#
- "1m is a month." A lowercase m is a minute; a month is an uppercase M.
- "The daily candle closes at midnight." Usually in UTC, which is not your local midnight.
- "The hourly chart is more precise, so it is better." It is more detailed, not better – and you see more noise in it.
Summary
- Timeframe = the length of one candle; lowercase m is a minute, uppercase M a month.
- O, H, L, C are the open, high, low and close; Vol is volume.
- The daily candle usually closes by UTC.
- Start with a longer timeframe for direction; log and % in the corner change the axis scale.